The energy industry is a cornerstone of the global economy. Oil, natural gas, electricity, and energy infrastructure not only drive industrial production and transportation but also shape inflation, interest rates, and the direction of global capital markets. As a result, energy ETFs have long been a vital tool for market participants worldwide.
For anyone looking to understand how the U.S. energy sector operates, XLE is more than just an ETF—it’s a key lens for observing the oil and gas value chain and the dynamics of energy cycles.
XLE’s Core Positioning
XLE’s core positioning is to track the market performance of large-cap U.S. energy companies. Unlike broad market index funds, XLE focuses exclusively on the energy sector. Its holdings are primarily drawn from oil, natural gas, refining, energy transportation, and integrated energy firms, making XLE’s performance a reliable gauge of the overall health of the U.S. energy sector.
The energy industry is an important part of the global economy. Oil, natural gas, electricity, and energy infrastructure affect not only industrial production and transportation, but also inflation, interest rates, and the direction of global capital markets. For this reason, energy ETFs have long been important sector tools watched by global markets.
For those looking to understand how the U.S. energy industry works, XLE is more than just an ETF. It is also an important window into the oil and gas value chain and the changing energy cycle.
XLE’s Core Positioning
XLE’s core positioning is to track the market performance of large U.S. energy companies. Unlike index funds that cover the entire stock market, XLE focuses specifically on the energy industry. Its holdings mainly come from oil, natural gas, refining, energy transportation, and integrated energy companies, so XLE’s performance can usually reflect the overall condition of the U.S. energy sector.
XLE is, in essence, a sector themed ETF. Sector themed ETFs focus on a specific industry. By holding multiple industry leaders, they reduce single company risk while preserving the return characteristics that come from industry growth or cyclical changes. From a market positioning perspective, XLE is closer to a broad representative of the U.S. energy industry than an investment tool tied to any single energy company.
Why XLE Tracks the U.S. Energy Sector
The United States is one of the world’s most important energy producers and consumers, with a complete oil and natural gas industry system.
From the shale oil revolution to liquefied natural gas exports, U.S. energy companies have gradually taken on an important role in the global energy market. Many leading international energy companies are also listed on U.S. capital markets, giving the U.S. energy sector strong representative value.
The energy industry has a clear cyclical nature. When global economic growth strengthens, industrial activity expands, or energy demand rises, the profitability of energy companies usually improves at the same time. Conversely, when energy prices fall or demand slows, industry profitability may also come under pressure.
Because of the important role the U.S. energy market plays in the global energy system, XLE uses U.S. energy companies as its main tracking target.
How XLE’s Holdings Are Constructed
XLE’s holdings are built around the U.S. energy value chain.
From an industry perspective, the energy market is not limited to oil production companies. The energy value chain covers resource exploration, production, transportation, refining, and sales, so an ETF needs to include different types of companies to provide full industry exposure.
A typical energy value chain can be divided into the following parts:
| Value Chain Segment |
Main Business |
| Upstream |
Oil and natural gas exploration and production |
| Midstream |
Pipeline transportation and storage |
| Downstream |
Refining and refined product sales |
| Integrated Energy |
Covers multiple parts of the energy business |
This value chain structure means XLE’s performance is not shaped by a single company alone. It is influenced by the operating condition of the entire U.S. energy industry.
In essence, XLE’s portfolio structure reflects the overall composition of the U.S. energy value chain.
How Energy Companies Generate Revenue
The revenue sources of energy companies are closely tied to where they sit in the value chain. Upstream energy companies mainly earn revenue by selling crude oil and natural gas, so their profitability is usually directly affected by energy prices. When international oil prices rise, upstream companies often see revenue and profits grow more quickly.
Midstream companies are mainly responsible for transportation and storage. Pipeline operators usually charge fees based on transport volume, so their cash flow tends to be relatively stable, and they are usually less sensitive to energy price swings than resource extraction companies.
Downstream companies generate profit through refining and energy sales. Refiners focus not only on changes in oil prices, but also on refined product demand and refining margins.
Because XLE covers multiple parts of the value chain at the same time, its market performance can usually reflect the operating condition of the entire energy industry chain.
How Crude Oil and Natural Gas Prices Affect XLE
Crude oil and natural gas prices are important factors affecting XLE’s volatility. The revenue, profits, and capital expenditure plans of energy companies are often closely linked to energy commodity prices. When international crude oil prices rise, the market usually raises its expectations for the future profitability of energy companies, which can push related stocks higher.
The natural gas market follows a similar logic. As global electricity demand grows and the energy mix changes, natural gas has gradually become an important energy source. Changes in natural gas prices can also affect revenue levels at related companies.
However, XLE does not directly track crude oil or natural gas prices. The ETF holds shares of energy companies, so factors such as market sentiment, operating efficiency, dividend policy, and capital allocation capability can also affect ETF performance.
For this reason, oil and gas prices are important variables for XLE, but they are not the only variables.
How XLE Differs from Broad Market ETFs
The biggest difference between XLE and broad market ETFs lies in sector concentration. Broad market ETFs usually cover multiple industries, such as technology, financials, healthcare, consumer sectors, and industrials. Different industries can provide a certain degree of risk diversification.
XLE, by contrast, mainly focuses on the energy industry, so its sector concentration is higher.
The table below shows the main differences between the two types of ETFs:
| Comparison Factor |
XLE |
Broad Market ETF |
| Coverage |
Energy industry |
Multi industry market |
| Risk Source |
Energy cycle |
Overall economic cycle |
| Volatility Drivers |
Oil and gas prices and energy demand |
Corporate earnings and macroeconomic conditions |
| Sector Concentration |
Higher |
Lower |
This difference means XLE is more easily affected by changes in the energy market, while broad market ETFs more often reflect movements in the overall stock market.
Main Use Cases for XLE
XLE is widely used in energy market research and sector allocation. For those focused on the energy industry, XLE can serve as an important reference for observing the condition of the U.S. energy market. Energy company profitability, changes in international oil prices, and trends in global energy demand are usually reflected in the ETF’s performance.
Some market participants use XLE to track cyclical changes in the energy sector. Because the energy industry has clear cyclical characteristics, XLE is often used to study the relationship between commodity markets and equity markets.
As global financial markets become more digital, some platforms have begun offering contracts for difference products related to energy ETFs. For example, some TradFi CFD products can track price changes in energy assets such as XLE, allowing users to participate in energy sector trading through different market tools.
Whether used to study the energy value chain, observe macroeconomic cycles, or follow energy price volatility, XLE is one of the important representative tools in the U.S. energy market.
Conclusion
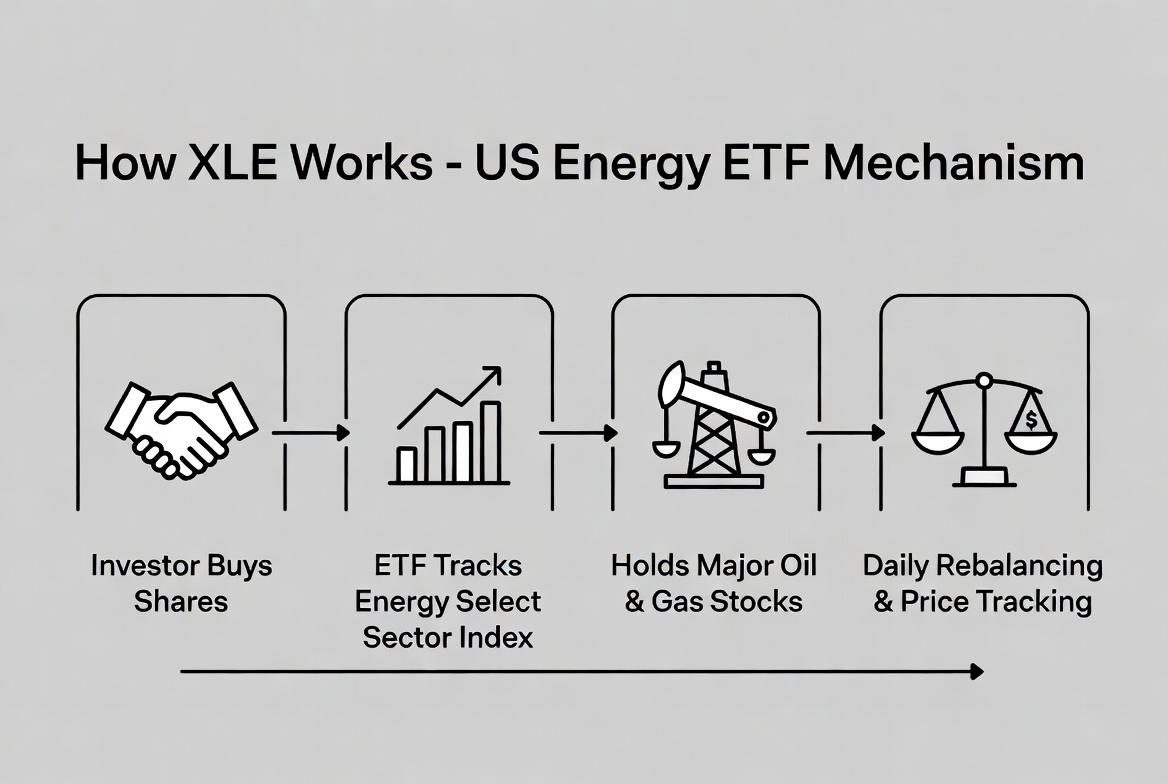
XLE is one of the most representative energy sector ETFs in the United States. It tracks the performance of the U.S. energy sector by holding shares of large oil and natural gas companies.
The structure of the energy value chain, energy company revenue models, changes in crude oil and natural gas prices, and global energy demand all work together to shape XLE’s market performance. Compared with broad market ETFs, XLE is more focused on the energy industry, so it can more directly reflect energy market cycles and industry trends.
For anyone who wants to understand how the U.S. energy market works, XLE offers an important way to observe the energy value chain and the energy economy.
FAQs
What Is XLE?
XLE is the ticker symbol for the Energy Select Sector SPDR Fund, a sector themed ETF that tracks the performance of large U.S. energy companies.
What Types of Companies Does XLE Mainly Hold?
XLE mainly holds U.S. energy companies involved in oil production, natural gas production, refining and processing, energy transportation, and integrated energy operations.
Does XLE Directly Track Crude Oil Prices?
XLE does not directly track crude oil prices. It holds shares of energy companies. However, changes in oil prices usually affect energy company profitability, which can indirectly affect XLE’s performance.
How Is XLE Different from an S&P 500 ETF?
XLE covers only the energy industry, while an S&P 500 ETF covers multiple industries. XLE has higher sector concentration and is more sensitive to energy market volatility.
Which Factors Most Often Affect XLE Volatility?
International oil prices, natural gas prices, global energy demand, economic growth expectations, and geopolitical risks are usually important factors affecting XLE volatility.
How Can XLE Be Traded?
XLE can be bought and sold through brokerage accounts that support U.S. stock trading. Some platforms also offer XLE related TradFi CFD products for tracking price movements in the energy sector.
Why XLE Tracks the U.S. Energy Sector
The United States is one of the world’s most significant energy producers and consumers, with a fully integrated oil and gas ecosystem.
From the shale revolution to LNG exports, U.S. energy companies have risen to prominence in global markets. A large number of international energy leaders are listed on U.S. exchanges, giving the U.S. energy sector high representativeness.
The energy industry is inherently cyclical. When global economic growth accelerates, industrial activity expands, or energy demand rises, energy companies’ profitability typically improves in tandem. Conversely, falling energy prices or slowing demand can pressure the sector’s earnings.
It is precisely because of the U.S. energy market’s pivotal role in the global system that XLE selects U.S. energy companies as its primary tracking target.
XLE’s holdings structure is built around the U.S. energy value chain.
From an industry perspective, the energy market encompasses far more than just oil extraction. The energy value chain spans resource exploration, production, transportation, refining, and sales. To achieve comprehensive sector coverage, the ETF must include companies across these diverse segments.
A typical energy value chain breaks down as follows:
| Industry Segment |
Primary Business |
| Upstream |
Oil and natural gas exploration & production |
| Midstream |
Pipeline transportation & storage |
| Downstream |
Refining & refined product sales |
| Integrated Energy |
Operations across multiple energy segments |
This structure means XLE’s performance is not driven by any single company but by the overall state of the U.S. energy industry.
In essence, XLE’s holdings composition mirrors the full makeup of the U.S. energy value chain.
How Energy Companies’ Revenue Models Work
Revenue streams for energy companies are closely tied to their segment in the value chain. Upstream companies earn primarily from selling crude oil and natural gas, so their profitability is directly exposed to energy prices. When international oil prices rise, upstream revenues and profits tend to grow rapidly.
Midstream companies focus on transportation and storage. Pipeline operators charge fees based on volume, giving them relatively stable cash flows and lower sensitivity to energy price swings compared to upstream firms.
Downstream companies generate profits through refining and energy sales. Refiners pay close attention not only to oil price movements but also to demand for refined products and refining margins.
Since XLE covers multiple segments simultaneously, its market performance generally reflects the operating conditions of the entire energy value chain.
How Crude Oil and Natural Gas Prices Affect XLE
Crude oil and natural gas prices are major drivers of XLE’s volatility. Energy companies’ revenues, profits, and capital expenditure plans are often tightly linked to commodity prices. When international crude oil prices climb, the market typically raises its expectations for energy companies’ future earnings, pushing their stocks higher.
A similar logic applies to natural gas. As global electricity demand grows and energy mixes shift, natural gas has become a key energy source. Changes in natural gas prices also impact the revenues of related companies.
That said, XLE does not directly track crude oil or natural gas prices. The ETF holds shares of energy companies, so factors like market sentiment, operational efficiency, dividend policy, and capital allocation also influence its performance.
Thus, oil and gas prices are important variables for XLE, but they are not the only ones.
How XLE Differs from Broad-Based ETFs
The key difference between XLE and broad-based ETFs lies in sector concentration. Broad-based ETFs typically span multiple sectors—such as technology, finance, healthcare, consumer goods, and industrials—providing natural diversification across industries.
XLE, by contrast, is concentrated in the energy sector, resulting in higher sector exposure.
The table below highlights the main differences:
| Dimension |
XLE |
Broad-Based ETF |
| Coverage |
Energy sector |
Multi-sector market |
| Risk source |
Energy cycle |
Broader economic cycle |
| Volatility driver |
Oil/gas prices & energy demand |
Corporate earnings & macroeconomics |
| Sector concentration |
High |
Low |
This means XLE is more sensitive to energy market dynamics, while broad-based ETFs reflect overall stock market trends.
Key Applications of XLE
XLE is widely used in energy market research and sector allocation. For those focused on the energy industry, XLE serves as a key barometer for the health of the U.S. energy market. Energy company profitability, international oil price movements, and global energy demand trends are all reflected in the ETF’s performance.
Some market participants use XLE to track cyclical shifts in the energy sector. Given the industry’s pronounced cyclical nature, XLE is frequently employed to study the linkage between commodity markets and equity markets.
As global financial markets digitize, some platforms now offer CFD products linked to energy ETFs. For example, certain TradFi CFD products track the price movements of energy assets like XLE, enabling users to participate in energy sector trading through different instruments.
Whether for analyzing the energy value chain, observing macroeconomic cycles, or monitoring energy price volatility, XLE stands as one of the most representative tools for the U.S. energy market.
Summary
XLE is one of the most iconic energy sector ETFs in the United States, tracking the U.S. energy sector’s performance by holding shares of major oil and natural gas companies.
The structure of the energy value chain, corporate profitability models, fluctuations in crude oil and natural gas prices, and global energy demand all shape XLE’s market performance. Compared to broad-based ETFs, XLE’s laser focus on energy makes it a more direct indicator of energy market cycles and sector trends.
For those seeking to understand how the U.S. energy market works, XLE offers an essential window into the energy value chain and energy economics.
FAQ
What is XLE?
XLE is the ticker symbol for the Energy Select Sector SPDR Fund, a sector-themed ETF that tracks the performance of large-cap U.S. energy companies.
What types of companies does XLE primarily hold?
XLE primarily holds U.S. energy companies in oil extraction, natural gas production, refining, energy transportation, and integrated energy operations.
Does XLE directly track crude oil prices?
No. XLE does not directly track crude oil prices; it holds shares of energy companies. However, oil price changes typically affect energy company earnings, which indirectly influences XLE’s performance.
What is the difference between XLE and S&P 500 ETFs?
XLE covers only the energy sector, whereas S&P 500 ETFs cover multiple sectors. XLE has higher sector concentration and is more sensitive to energy market volatility.
Which factors most easily impact XLE’s volatility?
International oil prices, natural gas prices, global energy demand, economic growth expectations, and geopolitical risks are typically the key drivers of XLE’s volatility.
How can I trade XLE?
XLE can be bought and sold through a brokerage account that supports U.S. stock trading. Some platforms also offer TradFi CFD products related to XLE for tracking energy sector price movements.