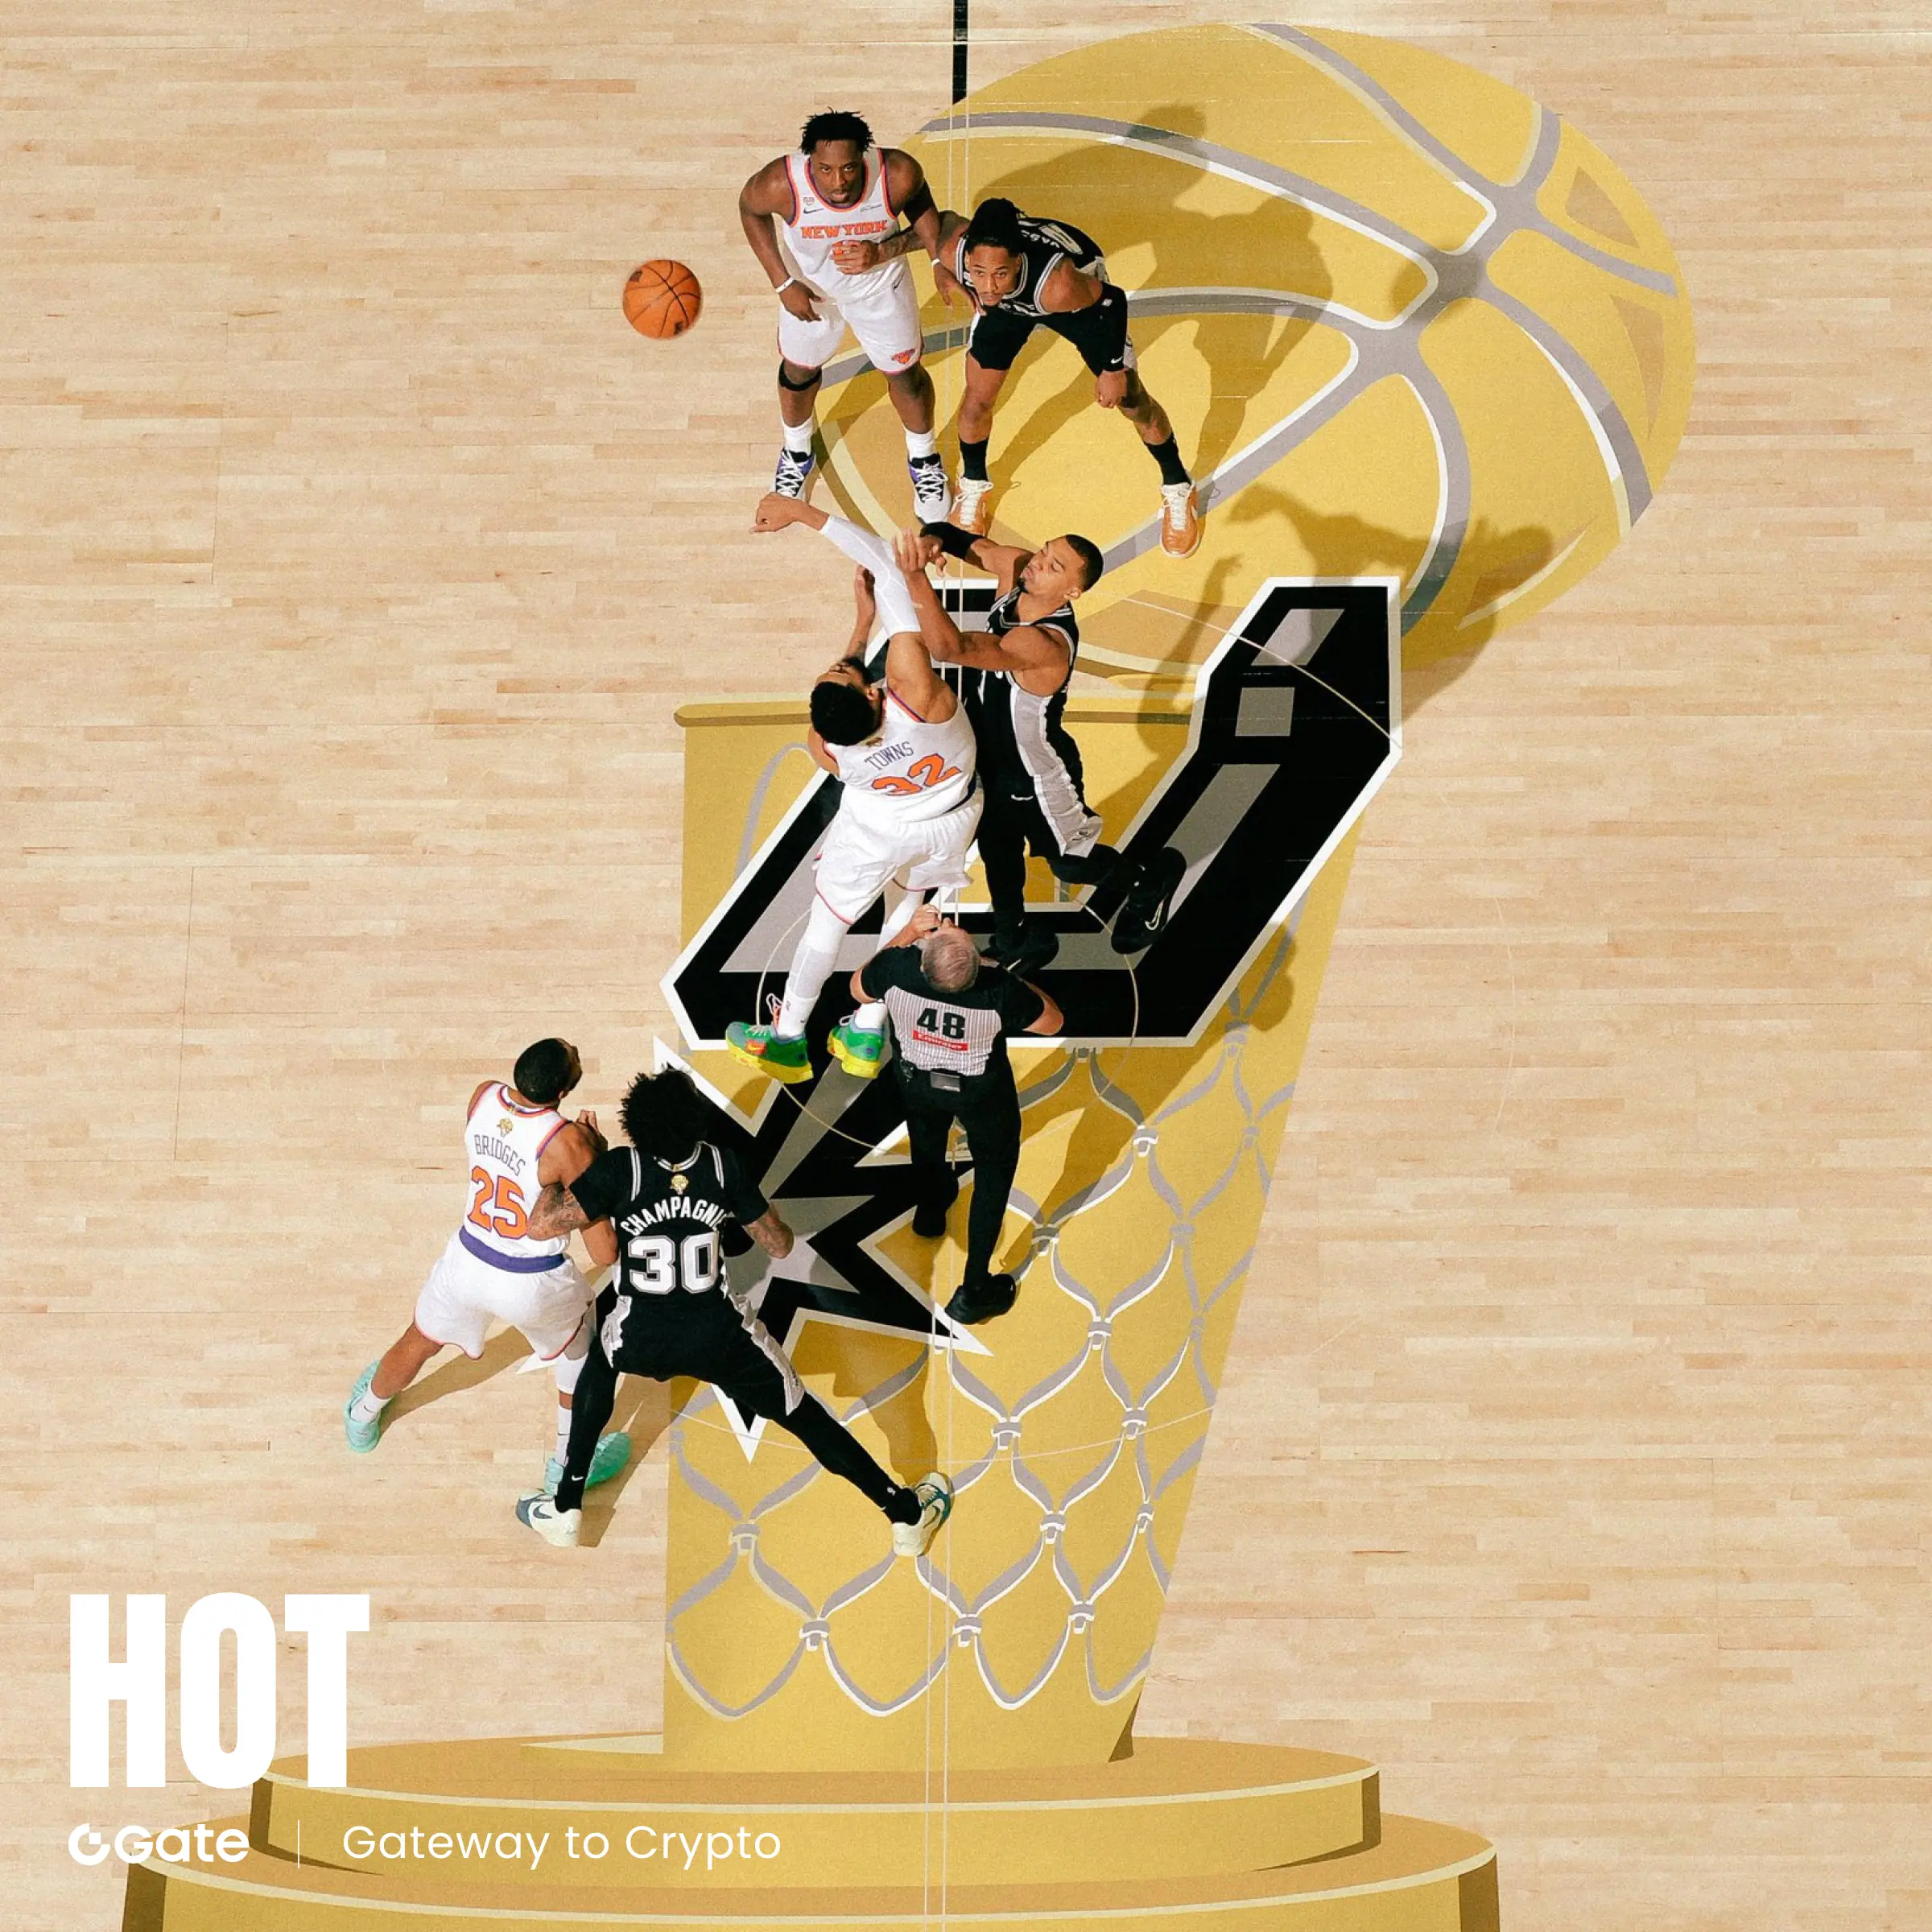
On June 6, 2026, Beijing time, after Game 2 of the NBA Finals ended, the New York Knicks edged the San Antonio Spurs 105:104, taking a 2:0 series lead. This 1-point margin not only changed the momentum of the series, but also significantly impacted how prediction markets price the eventual champion.
According to Gate’s prediction market data as of June 6, 2026, before G2 began, the Spurs’ win probability was about 67%, while the Knicks’ was about 34%. The spread line centered on the Spurs giving 6.5 points, and the total points line remained near 215.5, indicating the market expected the Spurs to control the game and sustain high-intensity matchups.
However, the actual result deviated clearly from market expectations. In the fourth quarter, the Knicks withstood the Spurs’ 14:0 counterburst and ultimately won by 1 point. After the game, the championship probability distribution changed dramatically: the Knicks’ title probability rose to 80%, while the Spurs fell to 20%. This shift of roughly 47 percentage points reflects the prediction market’s recalibration of structural judgment about the series.
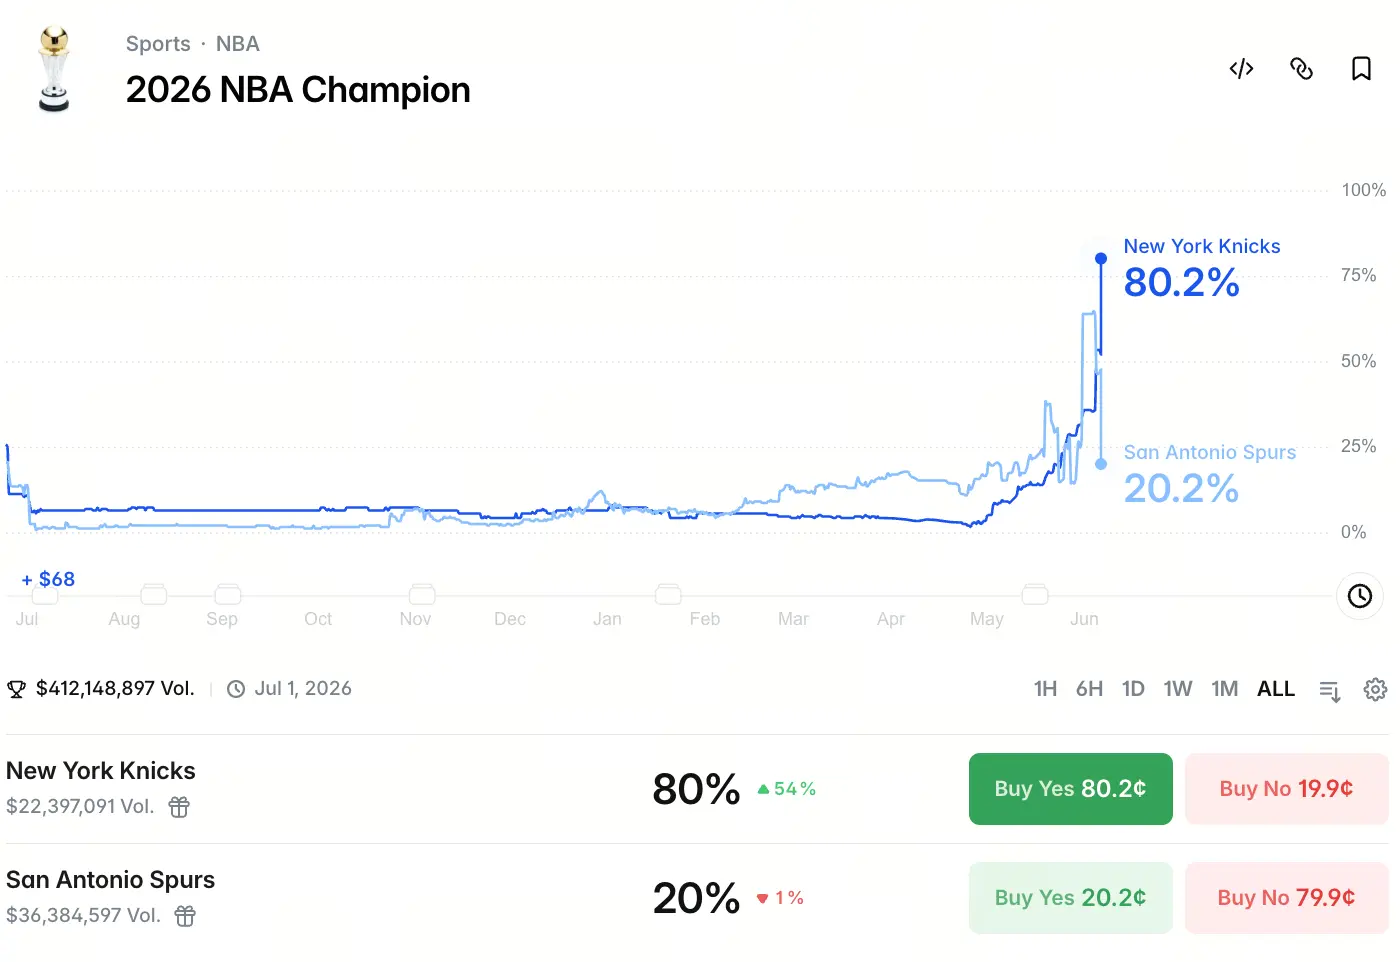
Source: Polymarket
It’s important to note that the probability changes are not based purely on the score outcome. Prediction markets incorporate the information advantage of many participants, including integrated judgments about complex variables such as player stamina, injury risks, officiating tightness, and home/away schedule rotation. The actual flow of G2—when the Knicks only won by 1 point despite all three of Towns, Brunson, and Bridges scoring 20+ at the same time—also suggests a cautious logic behind the probability adjustment.
From the change in the G2 betting line, what is the real gap between market expectation and the game result?
The pre-G2 line data provides another angle to observe expectations. With the Spurs favored by 6.5 points, the market implied the Spurs had a better than 60% chance to win by 7 points or more in a “normal” performance. But the actual result was the Knicks winning by 1 point—an expected-deviation of more than 7.5 points between the two.
This deviation has two statistical implications. First, the market may have overestimated the Spurs’ ability to sustain offensive performance in an away game (or on neutral ground). In G2, even though the Spurs produced a 14:0 offensive surge, they also committed fatal mistakes at the key moment—Victor Wembanyama’s game-winning jump shot in the final moments missed. Second, the market may have underestimated the Knicks’ adjustment capability when trailing. After being tied in the fourth quarter, the Knicks still managed to take the lead; Brunson tied the game with a crucial turnaround jumper and then sealed the win by converting free throws, demonstrating the team’s execution under high-pressure scenarios.
The total points line set at 215.5 resulted in the two teams combining for 209 points. The underperformance in scoring efficiency mainly came from both teams’ defensive tactical focus. The Spurs’ help-and-rotate schemes against the Knicks’ interior, as well as the Knicks’ point-of-attack coverage on Wembanyama and the timing of their traps, all compressed the usual offensive space. These micro-level variables are often the parts that prediction markets struggle to quantify with perfect precision when pricing lines.
What is the unique value of prediction markets compared with traditional analysis?
Traditional basketball analysis relies on historical data, advanced efficiency metrics (such as offensive efficiency, defensive efficiency, net efficiency), and experts’ subjective judgment. Prediction markets, however, are based on a “real money” collective decision mechanism—meaning their price signals naturally embed a risk premium for uncertainty about the future.
Taking the pre-G2 data as an example, the Spurs’ 67% win probability wasn’t simply derived from regular-season records or first-round performance. It reflected a combined set of information such as Wembanyama’s stamina recovery after G1, the foul-risk of Knicks players Hart and Towns, and the scoring stability of the bench unit. If such information were obtained through traditional media channels, there would be issues like time delays and information fragmentation.
Another unique value of prediction markets lies in their dynamic error-correction capability. Less than a few hours after G2 ended, the championship probabilities shifted rapidly from 34%:67% to 80%:20%. This adjustment speed is far beyond the iteration cycle of traditional statistical models. Participants’ trading behavior itself continuously digests new game information—injury reports, and even non-public signals like locker-room atmosphere.
2026 NBA Champion

New York Knicks
San Antonio Spurs
$2.13M Vol+28 more
For users in the crypto industry, Gate’s entry point to prediction markets is not just a sports betting tool, but a real-time window to observe how crowds’ wisdom can price real-world events. As the first CEX platform to integrate Polymarket, Gate maintains leading position in user participation scale and market activity. Users can access prediction markets directly through the Alpha entry on the homepage and use USDT to participate in event predictions.
In a 2:0 series lead, which variables could shake the win-probability model?
Even though the Knicks currently lead 2:0 and their title probability is as high as 80%, from a logical scenario analysis perspective, there are still several variables that could cause probabilities to be reallocated.
- Foul trouble for key players: In G2, Hart picked up his fourth personal foul in the third quarter, and Towns followed with his fifth. If, in subsequent away games, multiple Knicks starters run into foul trouble, the Spurs can exploit Wembanyama’s interior deterrence and Fox’s pick-and-roll driving ability to create scoring opportunities and force the Knicks to use deeper rotation players.
- Away-court environment: The remaining Finals games will move to the Spurs’ home court. There is empirical evidence for the influence of home-court advantage in the NBA Finals—home teams systematically benefit in officiating tightness, crowd energy, and even player psychology. Whether the Knicks can maintain G2’s key fourth-quarter execution on the road is a high-uncertainty variable in the win-probability model.
- Three-point shooting rate: In G2, the Knicks’ three-point performance showed fluctuations across different phases. If in subsequent games the Knicks’ outside shooting regresses toward the regular-season average, while the Spurs’ shooters such as Vassell and Castle also heat up, the margin could be widened again.
- Stamina allocation and rotation depth: The Spurs produced a 14:0 offensive burst in the late stages of G2, proving they can explode in a single quarter. After taking a 2:0 lead, the Knicks may face the risk of psychological looseness, while the Spurs’ do-or-die intensity can also change the series momentum.
The prediction market’s current 81% probability is not absolute certainty, but a risk price after integrating the assessment of the variables above. If any of them materialize, the probability distribution could shift significantly again.
How strong is the correlation between a 2:0 Finals start and eventually winning the championship?
Based on NBA historical data, teams that lead 2:0 in the Finals win the championship with a probability of about 85% to 90% (slightly different across statistical definitions). The prediction market’s current 80% is slightly below the historical average, and that discount may come from two reasons.
On one hand, the Spurs demonstrated a very strong ability to rebound in adversity in G2. From being down as much as 10 points to taking the lead with a 14:0 run in the fourth quarter, and then Wembanyama delivering a crucial 2+1 on the key play—tactical execution didn’t collapse despite the large deficit. Prediction market participants may believe this Spurs team has more comeback potential than most teams that fell behind 0:2 in history.
On the other hand, with the growing popularity of three-pointers and spacing tactics in modern basketball, game-to-game margin uncertainty has increased significantly. Even if a team is down 0:2 in a series, if it can hit an exceptionally high three-point rate in two consecutive games (for example, above 45%), it could fully swing and even the series. The prediction market pricing has already incorporated this variance effect.
It’s worth noting that the gap between historical statistics and prediction-market pricing is precisely the source of trading opportunities. If users believe the Spurs’ real comeback probability is higher than 20%, then the current market pricing may offer a participation window with positive expected value. Gate has also launched a dedicated “NBA Finals Knicks vs Spurs” prediction market event. The total prize pool is up to 20,000 USDT. Users who participate in prediction trades with at least 20 USDT have a chance to receive up to 10 USDT in rewards, lowering trial-and-error costs for participants.
Current championship probability distribution and scenario logic for the remaining series schedule
Based on post-G2 data and variable breakdowns, there are two scenario analyses for the rest of the series.
Scenario 1 (high-probability path): The Knicks win at least one game on the road. If the Knicks win Game 3 or Game 4, the series score could expand to 3:1 or 3:0. In this scenario, the prediction market’s championship probability could move further toward above 90%. The Knicks’ win-rate logic rests on three points: Towns’ low-post one-on-one and rebounding protection, Brunson’s scoring ability at critical moments, and Bridges’ all-around attributes on both offense and defense. If a situation where all three score 20+ in the same game as in G2 repeats, it will be difficult for the Spurs to limit all three offensive strong points at once.
Scenario 2 (low-probability but high-impact path): The Spurs win back two straight games, dragging the series into the “must-win” Game 5. If the Spurs use the home-court whistle and crowd energy to win both on their home floor, the series could become 2:2, and the prediction market’s probability distribution may quickly reset to nearly 50%:50%. The Spurs’ comeback pivot points are: Wembanyama’s dominance on both ends (29 points, 9 rebounds, 4 blocks in G2), Fox’s ball-handling pick-and-roll damage (20 points, 4 assists), and perimeter firepower support from Castle and Vassell.
The probability weights for these two scenarios depend on the injury reports and tactical adjustments made during the rest period before Game 3. As of now, no public information indicates that either side’s key players have severe injuries, which is a prerequisite for keeping the current probability distribution stable.
FAQ
Q: Is Gate’s prediction market championship probability updated in real time?
A: Yes. The prediction market prices integrated by Gate from Polymarket change in real time with participants’ trading behavior, and the probability data continues to reflect the latest market expectations and information inflow.
Q: If the Spurs had a 67% win rate before G2 but ultimately lost, does that mean the prediction market is inaccurate?
A: No. Prediction markets provide probabilities, not certainties. A 67% figure means that in similar scenarios the Spurs are expected to win about two-thirds of the time, but there is still about one-third probability of losing. A single game result cannot be used to negate the effectiveness of probability judgments.
Q: Does a championship probability of 80% mean the Knicks will surely win?
A: No. 80% means that, based on the current information set, the market thinks the Knicks’ championship chances are about 4.26 times that of the Spurs. However, there is still a 20% chance for the Spurs to come back, which needs to be considered in risk management.
Q: How can I participate in Gate’s NBA Finals prediction market event?
A: Users can enter the Polymarket page through the Alpha entry on the Gate App homepage and use USDT in their account to participate in prediction trades. New users can receive an additional 10 USDT reward for their first participation. Invite friends and you can stack additional rewards; a single inviter can receive up to 100 USDT.
Q: Can prediction market data be used for investment decisions?
A: Prediction market prices reflect the crowd’s collective judgment of event probabilities and can serve as an auxiliary reference. But no single data source should be used as the sole basis for a decision. Users should evaluate risk on their own and make judgments based on their specific circumstances.
