#USIranNegotiationGame #$LAB
LAB/USDT Deep Market Analysis — Momentum, Structure, Psychology & Project Outlook
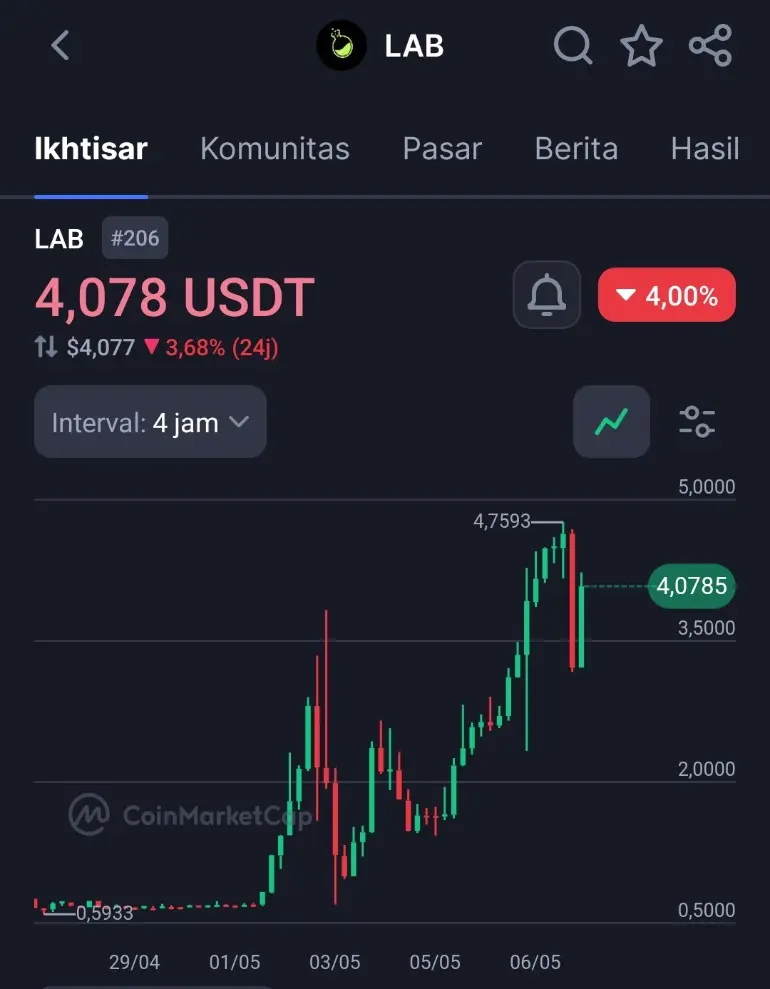
LAB has entered one of the most aggressive expansion phases seen in the current DeFi rotation cycle. The latest move above the mid-range consolidation zone pushed volatility sharply higher, while trading activity accelerated together with speculative participation. On the 4H structure, price expanded more than 31% within a short period and temporarily approached the upper volatility band, signaling strong short-term momentum but also elevated emotional trading conditions.
Current Market Structure
The chart shows a powerful impulsive breakout after a prolonged sideways compression phase between approximately 3.6 and 5.0 USDT. This type of structure usually indicates accumulation followed by liquidity expansion.
The most important observation is that price reclaimed the Bollinger mid-band and immediately accelerated toward the upper band. In strong momentum environments, this behavior often reflects aggressive buyer dominance and short liquidations rather than purely spot-driven demand.
At the moment, market participants appear divided into three groups:
Early buyers protecting profits
Momentum traders chasing continuation
Late entrants entering through emotional fear of missing out
That combination usually creates very sharp candles and unstable intraday swings.
Key Resistance Zones
First Resistance Area
5.90 — 6.15 USDT
This region is psychologically important because the current breakout candle is testing this zone aggressively. Sellers may attempt profit realization here.
Major Resistance Area
6.80 — 7.45 USDT
This is the strongest visible supply zone on the chart. The previous explosive wick toward 7.451 indicates heavy historical selling pressure and possible whale distribution activity.
If price reaches this region again with weakening volume, rejection probability rises significantly.
Key Support Zones
Immediate Support
5.20 — 5.35 USDT
Short-term momentum support. Remaining above this area preserves bullish control.
Structural Support
4.55 — 4.70 USDT
This aligns closely with the Bollinger middle band and previous consolidation range. A healthy correction could revisit this area without damaging the broader structure.
Critical Breakdown Zone
3.60 — 3.75 USDT
Loss of this region would severely weaken bullish structure and could trigger broader fear-driven selling pressure.
Volatility & Market Psychology
LAB currently reflects a classic high-beta speculative behavior pattern.
Several psychological stages are visible:
Compression Phase
Low attention, reduced volatility, silent accumulation.
Expansion Phase
Sudden volume growth attracts speculative capital.
Emotional Participation
Retail traders begin entering after large green candles appear.
Profit Rotation Risk
Early buyers may distribute positions into rising momentum.
The current stage appears to be between phases 3 and 4.
This is usually the period where volatility becomes extreme. Candle movements may become irrational temporarily due to leveraged positioning and aggressive sentiment swings.
Bollinger Band Analysis
The Bollinger Bands are expanding aggressively, which confirms volatility expansion.
Current structure suggests:
Upper band breakout momentum remains active
Mean reversion risk increases after vertical candles
Short-term overheating conditions may develop if volume weakens
When candles move too far away from the middle band without healthy consolidation, correction probability statistically rises.
Liquidity Behavior & Whale Activity
The chart structure suggests that liquidity sweeps are playing a major role.
Several long lower wicks indicate:
Stop-hunting behavior
Forced liquidations
Rapid absorption by larger participants
This kind of price action is common in smaller-cap high-volatility assets where liquidity depth remains limited.
Large players often exploit emotional entries by creating sharp upward expansions followed by rapid retracements.
DeFi Sector Context
LAB’s recent strength also aligns with broader renewed attention toward DeFi-related ecosystems and speculative infrastructure narratives.
Capital rotation inside crypto markets typically moves through phases:
Bitcoin dominance expansion
Large-cap altcoin recovery
Mid-cap speculative rotation
High-risk DeFi acceleration
LAB currently appears positioned inside the speculative rotation phase where traders seek higher volatility opportunities.
Risk Factors Investors Should Watch Carefully
Overextended Momentum
Parabolic candles rarely continue infinitely without consolidation.
Volume Sustainability
If price rises while volume declines, exhaustion risk increases.
Liquidation Cascades
Highly leveraged conditions can create sudden sharp reversals.
Whale Distribution
Large holders may use breakout excitement to exit positions gradually.
Emotional Trading
Fear-driven entries near resistance zones often create poor risk positioning.
What Strong Bulls Need To Maintain
For bullish continuation:
Price should remain above 5.20
Volume should remain elevated
Pullbacks should produce higher lows
Momentum candles should avoid immediate rejection
If these conditions remain valid, market structure can continue favoring upside continuation attempts toward higher resistance regions.
Professional Outlook
LAB currently shows one of the strongest short-term momentum structures among speculative DeFi-focused assets. However, the speed of the expansion also increases instability risk.
The most important factor now is whether buyers can transform this explosive breakout into sustainable higher-low structure instead of a temporary emotional spike.
Strong trends are built through:
Consolidation
Controlled pullbacks
Healthy volume continuation
Gradual market participation
If volatility becomes too aggressive without structural support formation, probability of sharp corrections rises significantly.
For disciplined investors, the coming sessions are likely more important than the breakout itself. Market behavior after excitement usually reveals whether the move represents genuine structural strength or temporary speculative overheating.
$LAB
LAB/USDT Deep Market Analysis — Momentum, Structure, Psychology & Project Outlook
LAB has entered one of the most aggressive expansion phases seen in the current DeFi rotation cycle. The latest move above the mid-range consolidation zone pushed volatility sharply higher, while trading activity accelerated together with speculative participation. On the 4H structure, price expanded more than 31% within a short period and temporarily approached the upper volatility band, signaling strong short-term momentum but also elevated emotional trading conditions.
Current Market Structure
The chart shows a powerful impulsive breakout after a prolonged sideways compression phase between approximately 3.6 and 5.0 USDT. This type of structure usually indicates accumulation followed by liquidity expansion.
The most important observation is that price reclaimed the Bollinger mid-band and immediately accelerated toward the upper band. In strong momentum environments, this behavior often reflects aggressive buyer dominance and short liquidations rather than purely spot-driven demand.
At the moment, market participants appear divided into three groups:
Early buyers protecting profits
Momentum traders chasing continuation
Late entrants entering through emotional fear of missing out
That combination usually creates very sharp candles and unstable intraday swings.
Key Resistance Zones
First Resistance Area
5.90 — 6.15 USDT
This region is psychologically important because the current breakout candle is testing this zone aggressively. Sellers may attempt profit realization here.
Major Resistance Area
6.80 — 7.45 USDT
This is the strongest visible supply zone on the chart. The previous explosive wick toward 7.451 indicates heavy historical selling pressure and possible whale distribution activity.
If price reaches this region again with weakening volume, rejection probability rises significantly.
Key Support Zones
Immediate Support
5.20 — 5.35 USDT
Short-term momentum support. Remaining above this area preserves bullish control.
Structural Support
4.55 — 4.70 USDT
This aligns closely with the Bollinger middle band and previous consolidation range. A healthy correction could revisit this area without damaging the broader structure.
Critical Breakdown Zone
3.60 — 3.75 USDT
Loss of this region would severely weaken bullish structure and could trigger broader fear-driven selling pressure.
Volatility & Market Psychology
LAB currently reflects a classic high-beta speculative behavior pattern.
Several psychological stages are visible:
Compression Phase
Low attention, reduced volatility, silent accumulation.
Expansion Phase
Sudden volume growth attracts speculative capital.
Emotional Participation
Retail traders begin entering after large green candles appear.
Profit Rotation Risk
Early buyers may distribute positions into rising momentum.
The current stage appears to be between phases 3 and 4.
This is usually the period where volatility becomes extreme. Candle movements may become irrational temporarily due to leveraged positioning and aggressive sentiment swings.
Bollinger Band Analysis
The Bollinger Bands are expanding aggressively, which confirms volatility expansion.
Current structure suggests:
Upper band breakout momentum remains active
Mean reversion risk increases after vertical candles
Short-term overheating conditions may develop if volume weakens
When candles move too far away from the middle band without healthy consolidation, correction probability statistically rises.
Liquidity Behavior & Whale Activity
The chart structure suggests that liquidity sweeps are playing a major role.
Several long lower wicks indicate:
Stop-hunting behavior
Forced liquidations
Rapid absorption by larger participants
This kind of price action is common in smaller-cap high-volatility assets where liquidity depth remains limited.
Large players often exploit emotional entries by creating sharp upward expansions followed by rapid retracements.
DeFi Sector Context
LAB’s recent strength also aligns with broader renewed attention toward DeFi-related ecosystems and speculative infrastructure narratives.
Capital rotation inside crypto markets typically moves through phases:
Bitcoin dominance expansion
Large-cap altcoin recovery
Mid-cap speculative rotation
High-risk DeFi acceleration
LAB currently appears positioned inside the speculative rotation phase where traders seek higher volatility opportunities.
Risk Factors Investors Should Watch Carefully
Overextended Momentum
Parabolic candles rarely continue infinitely without consolidation.
Volume Sustainability
If price rises while volume declines, exhaustion risk increases.
Liquidation Cascades
Highly leveraged conditions can create sudden sharp reversals.
Whale Distribution
Large holders may use breakout excitement to exit positions gradually.
Emotional Trading
Fear-driven entries near resistance zones often create poor risk positioning.
What Strong Bulls Need To Maintain
For bullish continuation:
Price should remain above 5.20
Volume should remain elevated
Pullbacks should produce higher lows
Momentum candles should avoid immediate rejection
If these conditions remain valid, market structure can continue favoring upside continuation attempts toward higher resistance regions.
Professional Outlook
LAB currently shows one of the strongest short-term momentum structures among speculative DeFi-focused assets. However, the speed of the expansion also increases instability risk.
The most important factor now is whether buyers can transform this explosive breakout into sustainable higher-low structure instead of a temporary emotional spike.
Strong trends are built through:
Consolidation
Controlled pullbacks
Healthy volume continuation
Gradual market participation
If volatility becomes too aggressive without structural support formation, probability of sharp corrections rises significantly.
For disciplined investors, the coming sessions are likely more important than the breakout itself. Market behavior after excitement usually reveals whether the move represents genuine structural strength or temporary speculative overheating.
$LAB